

Key Takeaways
- 01 Producing an ounce of gold cost US$1,785 on average in Q1 2026, the 28th straight year-on-year increase.
- 02 Royalties were the biggest cost driver and doubled to 12% of AISC in five years.
- 03 Record margins of US$3,076 per ounce let miners absorb the cost inflation.
When most people hear “record gold price,” they assume every mine is raking it in. It is not that simple. The price of an ounce must be greater than the cost to mine it for a mine to make money.
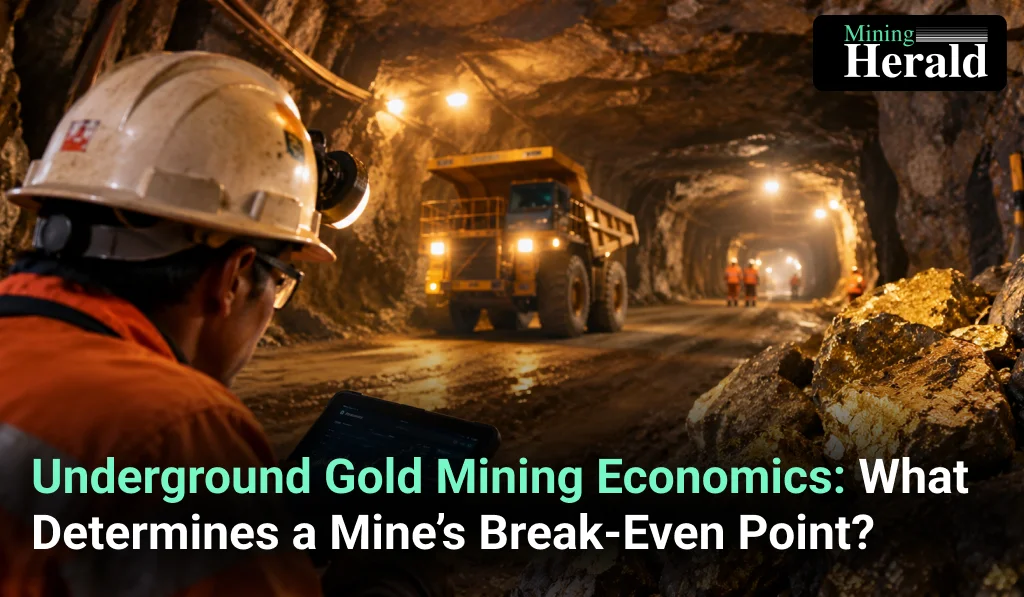
Underground gold mining costs arrive early. The break-even level is more significant than the headline price. Miners spend a lot of money on shafts and ground support, and those costs seem to be well before the first pour.
Eight Factors Set the Underground Break-Even Line
| Factor | Effect on break-even |
|---|---|
| Gold price | A higher realised price can cover a higher cost base |
| Ore grade | Richer rock means less ore moved and processed per ounce |
| Underground development | Shafts, declines and ventilation need large upfront capital |
| Labour and contractors | Skilled crews and maintenance teams lift operating costs |
| Energy and fuel | Power, pumping, haulage and processing can add materially |
| Recovery rate | Higher recovery means more saleable gold from each tonne |
| Royalties and refining | Both reduce the revenue a mine retains |
| Sustaining capital | Equipment replacement and infrastructure upkeep weigh on long-term profit |
Gold Mine Operating Costs Climb to US$1,785 Per Ounce
Metals Focus puts the average producer’s AISC in Q1 2026 at US$1,785 per ounce. That is up 5% on the previous quarter and 16% on a year earlier, the 28th straight annual rise.
The World Gold Council says AISC aims to reflect the full cost of keeping a mine in business.
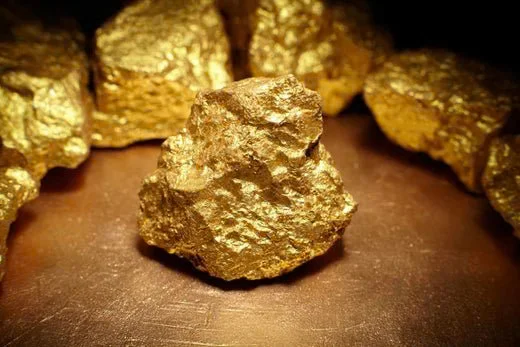
Figure 1: Rough gold nuggets of varying size arranged on a reflective surface [Courtesy: GoldUnion UK]
Royalties Take a Bigger Bite as Gold Prices Climb
Royalties did the most to lift costs in Q1 2026. The different tax regimes and an increase in resource nationalism meant that some countries were affected more than others.
Royalty payments increased 24% from the prior quarter and were 85% higher than a year ago.
| Royalty measure | Q1 2021 | Q1 2026 |
|---|---|---|
| Royalties as a share of AISC | About 6% | 12% |
| Country | Change | Detail |
|---|---|---|
| Ghana | In March 2026, it changed from a flat 5% royalty to a sliding system. | Rate can reach 12% when gold trades above US$4,500 per ounce |
| Burkina Faso | Introduced a sliding scale in 2025 | Gold prices in the 10% category range from $4,000 to $4,500 per ounce. |
| Mali | Sliding scale took effect in 2024 | Rate reaches 9.5% at US$4,100 per ounce |
Essakane, IAMGOLD’s mine in Burkina Faso, shows the effect clearly. Royalty costs there surged 220% year on year and made up 35% of cash costs.
Fuel, Freight and Consumables Compound the Royalty Pressure
The Iran conflict and the shutdown of the Strait of Hormuz strained supply chains around the world. Larger producers coped better than juniors.
- US diesel prices ended the quarter 54% higher. Wholesale diesel in Perth jumped 96%.
- Some smaller Western Australian operations reportedly suspended activity because of fuel constraints.
- Evolution Mining said existing fuel contracts prevented disruption. OceanaGold had hedged about 80% of annual diesel use.
- Gold Fields recorded a 40% rise in freight and consumables costs since the Iran war began.
- Gas and ammonia disruption lifted prices for explosives and sodium cyanide.
Record Margins Gave Miners Room to Absorb Cost Inflation
Gold rose 17% quarter-on-quarter and 70% year-on-year, far outpacing cost growth. Average AISC margins hit a record US$3,076 per ounce.
Spending stayed tighter this cycle than in past upswings. Many producers have now moved into net cash. A large share of their surplus is going to shareholders through dividends and buybacks.
Newmont returned US$2.7 billion to shareholders after record quarterly free cash flow of US$3.1 billion. AngloGold Ashanti generated record free cash flow of US$1.2 billion and moved into net cash.
Industry Outlook
Metals Focus expects costs to climb further while the Iran conflict and supply chain disruption continue. Much of the escalation came late in Q1 2026. The full effect on fuel, freight and consumables should show in Q2 2026. Gold has slipped from its January peak but remains well supported.
Gold Price and Cost Metrics Show the Margin Gap in Numbers
Metals Focus data shows how global prices and costs moved. Changes are quarter-on-quarter (q/q) and year-on-year (y/y).
| Metric | Reading | Change |
|---|---|---|
| Global average AISC | US$1,785 per ounce | Up 5% q/q, 16% y/y |
| Average AISC margin | US$3,076 per ounce | Up 25% q/q, 134% y/y |
| 90th percentile AISC margin | US$2,363 per ounce | Up 32% q/q |
| Average gold price | Record quarterly average | Up 17% q/q, 70% y/y |
| Q2 2026 average gold price | Above US$4,000 per ounce | Down 7.2% q/q |
Rising Costs and Softer Prices Will Test Producer Margins
Impact on producer margins: Metals Focus says resilience may be tested as costs rise and prices ease.
Impact on junior producers: smaller operators were more exposed to fuel disruption than hedged majors.
Impact on royalty exposure: sliding scales link rates to gold price, so higher prices raise government take.
For any underground operation, the gold mining break-even point moves with each factor in the table above. Mining Herald will keep tracking how Q2 2026 cost data changes that picture.
FAQs
Q1: What is the gold mining break-even point?
Ans: The gold price at which revenue covers the full cost of producing and sustaining output.
Q2: What drives underground gold mining costs?
Ans: Development, labour, energy, recovery rates, royalties, refining, and sustaining capital are all factors.
Q3: What is AISC?
Ans: All-in Sustaining Cost. The metric aims to capture the full cost of keeping a mine running.
Q4: Why did royalties rise in 2026?
Ans: Higher gold prices lifted payments, and sliding scales in Ghana, Burkina Faso and Mali raised rates.
Disclaimer
This article is intended for informational purposes only. If you pay attention to the gold mining sector as an investor, then all the data in the content is from third-party sources. Please check out the complete share price and market data info. Investing carries a high risk, and you should only invest at your own risk. Mining Herald has no involvement in the above-listed companies.
Filed under

About the author
Jonathon Brown
Jonathon Brown began his career as a broadcaster, working across markets in British Columbia before moving into financial journalism. Since 2017, he has specialised in stock market reporting, covering emerging companies across the healthcare, technology, mining and consumer sectors. He brings more than 15 years' experience to his reporting. A graduate of Vancouver Island University and the British Columbia Institute of Technology, Jonathon is focused on delivering clear, balanced reporting for investors.