


Key Takeaways
- 01 Capital discipline is reshaping commodity supply curves into 2026.
- 02 AI infrastructure capex is becoming a primary macro variable.
- 03 Central bank policy across AU, CA and US is converging on neutral.
Miners get paid for metal, not rock. Between the pit and the sale sits a processing plant, and that plant never captures everything it receives. Metallurgical recovery rates put a number on what it does capture.
The figure moves project economics, plant design and the assumptions investors build into valuations. Three NASDAQ miners have published recovery testwork, and their results differ for technical reasons.
What Metallurgical Recovery Rates Measure
Metallurgical recovery is the share of the metal fed to a processing plant that actually comes out as a saleable product. The rest goes to tailings. Take ore holding 100 grams of gold, with 90 grams captured. The recovery rate is 90%.
The Mining Recovery Rate Calculation in One Line
Recovery Rate (%) = (Metal Recovered ÷ Metal Contained in Feed) × 100
The mining recovery rate calculation needs both figures from the same period and circuit stage.
Three NASDAQ Miners Report Very Different Recovery Profiles
Collective Mining Records 95% Gold Recovery in Locked Cycle Tests at Apollo
In its 25 Aug 2026 announcement, Collective Mining Ltd. (NASDAQ: CNL) reported results for Apollo, part of its Guayabales Project in Caldas, Colombia. A master composite returned 95% gold, 92% silver and 85% copper recovery in locked cycle tests.
The composite carried 1.4 g/t gold, 20 g/t silver and 0.08% copper. Gravity concentration took more than half the gold in some tests.
Copper recovery reached 90% or better above 0.15% copper and averaged about 80% below it. Apollo shows one deposit yielding several metals through gravity, flotation and cyanidation.
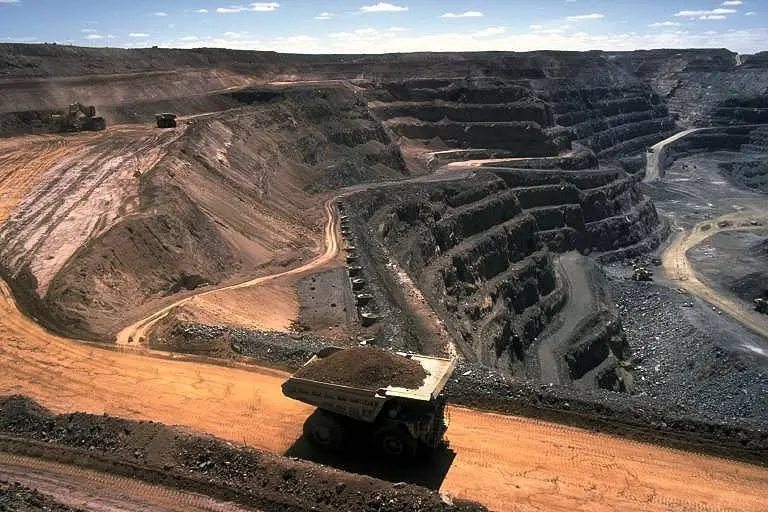
Figure 1: Haul truck working in an open pit mine [Courtesy: Wikipedia]
U.S. GoldMining Adds Leaching to Lift Whistler Gold Recovery to 85.3%
U.S. GoldMining Inc. (NASDAQ: USGO) owns the Whistler Gold-Copper Project, Alaska. The Company announced the results on 22 Sep 2025.
| Processing stage | Gold | Copper | Silver |
| Flotation (concentrate grading 23.7% copper) | 54.1% | 79.1% | 55.3% |
| Leaching of remaining tails | 31.2% additional | None reported | None reported |
| Combined result | Up to 85.3% | 79.1% | 55.3% |
- Flotation alone was used in earlier testwork, recovering approximately 70% of the gold.
- The Company described the combined route as a 22% improvement.
Nova Minerals Looks to Heap Leaching for Lower Grade Ore at RPM
Nova Minerals Limited (NASDAQ: NVA) is studying its RPM deposit, part of the Estelle Project in Alaska. Heap leach column tests recovered 68.7% of the gold from lower-grade material at a 3.35 mm crush after 59 days, as announced on 4 Aug 2025.
Nova would split its ore by grade. Anything above 2 g/t gold would go to a carbon-in-pulp or carbon-in-leach circuit. Poorer rock would meet an ore sorter first. The sorter lifts the grade of the plant feed. Its rejects go to heap leaching, which recovers gold from rock that would otherwise be discarded.
Industry Outlook
A single route only rarely fits a complex or lower grade deposit. Collective Mining plans separate copper and tungsten circuits alongside cyanidation for gold and silver.
Readers should keep three things apart. Lab results come from small samples under controlled conditions. Feasibility assumptions are design inputs. Commercial performance is what a plant delivers over years, and it can differ from both.
Pending Metallurgical Work Will Test These Recovery Figures
Collective Mining expects full Ramp Zone results in H1 2027 and plans a 2027 licensing submission. In its 22 Sep 2025 announcement, U.S. GoldMining said its flowsheet was not finalised, so recoveries in its then ongoing economic assessment could differ. Nova Minerals is running CIP/CIL testwork for its Pre-Feasibility Study.
The impact falls on project economics and on the assumptions investors carry into each Project valuation.
Mining Herald will track how these recovery figures hold up as studies advance.
ALSO READ: Copper Mining Companies on the LSE: How to Assess Production Growth and Project Risks
FAQs
Q1. What are metallurgical recovery rates?
Ans. They state what percentage of the metal fed to a plant leaves in a saleable product.
Q2. How is the mining recovery rate calculation done?
Ans. The recovered metal is divided by the contained metal in the feed and is multiplied by 100.
Q3. Do laboratory results guarantee mineral processing recovery at commercial scale?
Ans. No. Small controlled tests can differ from full-scale operations.
Disclaimer
This article is intended for informational purposes only. If you pay attention to the NASDAQ mining sector as an investor, then all the data in the content is from third-party sources. Please check out the complete share price and market data info. Investing carries a high risk, and you should only invest at your own risk. Mining Herald has no involvement in the above-listed companies.
Filed under

About the author
Jonathon Brown
Jonathon Brown began his career as a broadcaster, working across markets in British Columbia before moving into financial journalism. Since 2017, he has specialised in stock market reporting, covering emerging companies across the healthcare, technology, mining and consumer sectors. He brings more than 15 years' experience to his reporting. A graduate of Vancouver Island University and the British Columbia Institute of Technology, Jonathon is focused on delivering clear, balanced reporting for investors.