



Key Takeaways
- 01 Capital discipline is reshaping commodity supply curves into 2026.
- 02 AI infrastructure capex is becoming a primary macro variable.
- 03 Central bank policy across AU, CA and US is converging on neutral.
The Silver moving average breakdown has left buyers facing a difficult test. Immediate support stood at US$60.66. That left little room between the quoted price and a level the analysis identified as important for the next stage of the decline.
However, two details deserve care. The moving average belongs to a five-hour chart, rather than a daily chart. Also, silver remained above US$60.66 in that snapshot, meaning a confirmed failure of this separate support level had not yet occurred.
What Does the Moving Average Breakdown Actually Show?
A moving average smooths price fluctuations. When prices remain beneath it, chart watchers often interpret the pattern as evidence that selling pressure is outweighing buying interest.
The timeframe changes the meaning, though. A 200-period average on a five-hour chart covers 200 five-hour candles. It is not the widely followed 200-day moving average, and it should not be presented as proof that a multi-year support level has failed.
The supplied analysis also identifies a completed double-top pattern around US$71.16. This describes two attempts to sustain higher prices that were followed by weakness. Without the underlying chart, its neckline and confirmation cannot be independently assessed here.
Together, these observations support a bearish technical reading. They do not establish how far prices must fall.
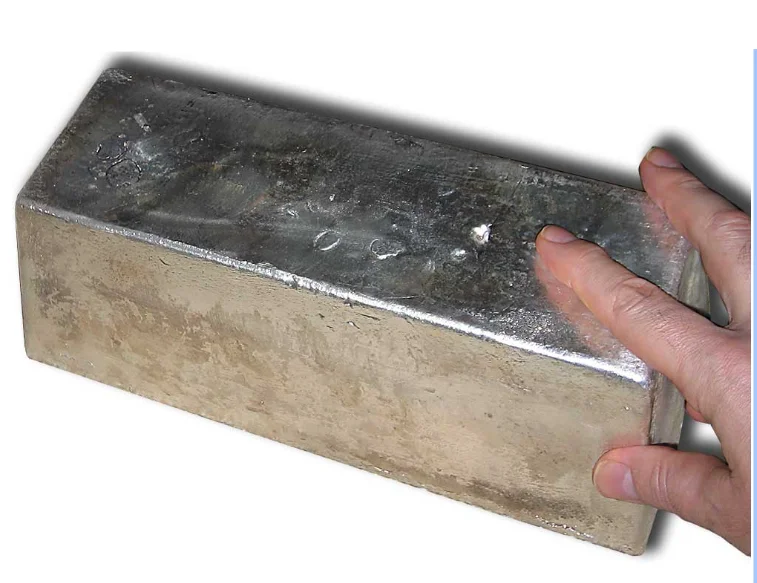
Figure 1: A 1,000-ounce silver bullion bar, illustrating the physical metal underlying silver markets. Credit: Unit 5, via Wikimedia Commons, CC BY-SA 3.0.
Which Price Levels Could Shape Silver’s Next Move?
The immediate question is whether buyers can defend US$60.66. A sustained move below that level would strengthen the bearish interpretation described in the supplied analysis.
Above the market, several hurdles separate a modest rebound from a stronger recovery.
| Reference level | Role in the supplied analysis |
|---|---|
| US$60.66 | Immediate support |
| US$61.00–US$63.00 | Potentially unsettled trading range |
| US$63.50–US$64.50 | Resistance area associated with technical indicators |
| US$65.58 | Five-hour 200-period moving average |
| US$55.00 and US$53.00 | Conditional downside targets |
All prices are expressed per troy ounce.
Three possible developments would help clarify direction:
- Support holds: Repeated defence of US$60.66 could give buyers room to attempt a rebound.
- Support breaks: Trading below US$60.66, followed by difficulty reclaiming it, would strengthen the downside case.
- Resistance is recovered: A sustained move through US$63.50–US$64.50 would challenge the immediate bearish structure.
The source also describes US$60.00 as an invalidation level for bears. That conflicts with its broader argument that lower prices confirm weakness, so it is not used here as a reliable signal.
For context on market quotations, CME Group’s silver futures overview specifies US dollars and cents per troy ounce.
Could Weak Momentum Still Produce a Rebound?
Yes. A bearish trend can contain sharp upward moves, particularly after a sustained decline.
The five-hour Relative Strength Index stood at 33.4 in the supplied snapshot. That indicates weak momentum but remains above the conventional oversold threshold of 30.
As explained in Fidelity’s guide to the Relative Strength Index, readings below 30 are traditionally considered oversold. The indicator can nevertheless remain depressed during a strong downtrend.
The Silver market bearish pressure trend therefore leaves room for a bounce without establishing a lasting recovery.
Three distinctions matter:
- A bounce changes the immediate price: It may reflect fresh buying or traders closing bearish positions.
- A recovery needs follow-through: Holding above reclaimed resistance would provide stronger evidence than a brief upward spike.
- An RSI reading is supporting evidence: It does not determine when sellers will retreat or buyers will gain control.
The source lists US$64.20,US$65.60 and US$67.15 as potential upside objectives. These are conditional scenario levels, not forecasts that silver will reach them.
Its commentary also reports rising volume during breakdowns. However, the excerpt does not identify the volume feed. That limits how confidently this observation can be applied across spot and futures markets.
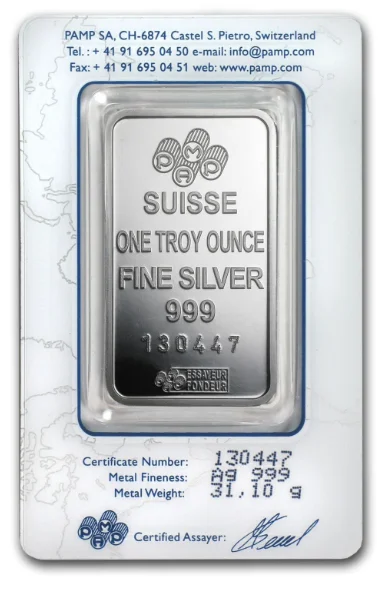
Figure 2: A silver bullion bar with an assay card. The photograph illustrates physical bullion, rather than current trading conditions. Credit: Kjmonkey, via Wikimedia Commons, CC0 public-domain dedication.
Why Should Investors Treat the Trading Scenarios Carefully?
The supplied bullish and bearish scenarios combine different entry prices, stops and targets. Their quoted risk-to-reward ranges cannot be applied uniformly to every combination.
This calculation does not recommend the trade. It shows why each scenario needs to be checked independently.
A useful Silver long-term support failure analysis must also separate chart observations from business fundamentals. This snapshot provides no new evidence about mine output, industrial consumption, inventories or individual producers’ earnings.
For mining shareholders, the chart can help explain market sentiment. It cannot establish how a particular company’s cash flow will change without production, cost and sales information.
These should remain separate observations rather than being combined into one supposedly current price.
What Would Make the Outlook Clearer From Here?
The next useful evidence will come from price behaviour around support and resistance, using a consistent instrument and timeframe.
For Mining Herald readers, the main checkpoints are straightforward:
- Watch US$60.66: Determine whether support holds, breaks briefly or gives way more persistently.
- Assess rebound quality: Look for sustained progress through US$63.50–US$64.50 rather than a short-lived rally.
- Refresh the indicators: Moving averages and RSI readings change as new candles form.
The Silver moving average breakdown describes a weak technical position at a specific time. It does not guarantee the downside targets or rule out a recovery.
For now, the clearest distinction is between confirmed weakness below the five-hour moving average and the still-unresolved test of nearby support.
Also Read: Why Critical Minerals Are Key to the Global Energy Transition
FAQs
- Has silver broken its 200-day moving average?
The supplied data refers to a 200-period average on a five-hour chart, not a 200-day average. - Which support level matters most?
The analysis identifies US$60.66 per troy ounce as immediate support. - Does an RSI of 33.4 guarantee a bounce?
No. It indicates weak momentum but cannot predict a reversal. - Are the downside targets certain?
No. US$58,US$55 and US$53 are conditional technical targets.
Disclaimer
Prepared for Mining Herald for general information, using the supplied 29 September 2026 market snapshot. This article is not investment advice. Technical indicators and price scenarios are uncertain, and market conditions can change quickly. Readers should verify current quotations and consider their circumstances before making investment decisions.
Filed under

About the author
Jonathon Brown
Jonathon Brown began his career as a broadcaster, working across markets in British Columbia before moving into financial journalism. Since 2017, he has specialised in stock market reporting, covering emerging companies across the healthcare, technology, mining and consumer sectors. He brings more than 15 years' experience to his reporting. A graduate of Vancouver Island University and the British Columbia Institute of Technology, Jonathon is focused on delivering clear, balanced reporting for investors.