
Key Takeaways
- 01 Capital discipline is reshaping commodity supply curves into 2026.
- 02 AI infrastructure capex is becoming a primary macro variable.
- 03 Central bank policy across AU, CA and US is converging on neutral.
The historical relationship between rising bond yields and falling precious metals shows clear signs of breaking. Markets previously expected higher rates to push asset values significantly lower.
However, the current interest rate outlook gold prices dynamic tells a completely different story. Yields on 10-year government bonds climbed from 4.5% to over 5.2% recently.
Despite this sharp rise in yields, bullion maintained steady support levels. The asset currently trades firmly in the $4,000 to $4,500 per ounce range.
This consolidation phase indicates a solid price floor. The market faces tough economic conditions, yet the metal refuses to drop further.
Conflict and Inflation Concerns
Global events continue to shape financial strategies across the board. The ongoing Iran conflict creates severe supply chain issues and pushes energy costs higher.
Higher energy costs directly translate into fears of rising consumer prices. This situation perfectly highlights the current inflation uncertainty gold market impact.
Central bankers often respond to these fears with tighter monetary policies. Investors traditionally view these rising rates as a negative factor for precious metals.
Market forces now push back against this traditional view. The fear of persistent price increases overrides the fear of higher borrowing costs entirely.

Fig 1: The budget outlook [seekingalpha.com]
Central Banks Drive Market Demand
Global central banks continue to purchase vast volumes of physical reserves. China leads this global acquisition trend quite clearly.
Reports indicate China imported approximately 1,000 tonnes of the metal this year alone. Analysts suggest the country purchases far more than official reports state.
These institutions absorb between a fifth and a third of yearly mined supply. This robust institutional demand offsets retail selling pressures perfectly.
Buyers view current price levels as an excellent entry point. They act swiftly to protect their national reserves from fiat currency risks.
ETF Structures and Market Access
Investors often access this market through exchange-traded funds. The SPDR Gold Shares ETF offers direct exposure to physical holdings.
The fund tracks spot prices quite closely over long periods. A minor 0.4% expense ratio creates a small drag on overall long-term performance.
Some market participants question the lack of physical delivery options. Investors can easily sell shares and buy physical metal themselves if desired.
The fund operates without any credible structural problems after two decades. This reliability provides confidence for institutional and retail participants alike.
Deficits Fuel Future Price Rallies
Major economies face severe and growing structural deficits. The US and France currently run deficits between 5% and 6% of their total output.
Debt-to-GDP ratios for these nations now sit near a worrying 120%. Germany remains the only G7 member under 100%, but its fiscal health deteriorates rapidly.
Higher borrowing costs complicate this economic picture entirely. Governments must refinance old, low-yield debt at today’s much higher rates.
This refinancing creates a vicious cycle of rising debt-servicing costs. The US might spend $1.7 trillion annually just on interest within the next decade.
Evaluating Long-Term Price Targets
Economic analysts predict central banks will avoid holding excess US dollars. They naturally favour tangible assets to escape rising global fiscal pressures.
This clear shift sets the stage for a strong turnaround starting in 2027. The next market cycle could deliver robust gains for the precious metal.
Some models project prices reaching $12,000 per ounce before the decade ends. The strong 2023-2025 performance offers a solid precedent for this future growth.
This positive gold price forecast, interest rates, and inflation combination creates a highly favourable environment. Investors see excellent potential for future appreciation.
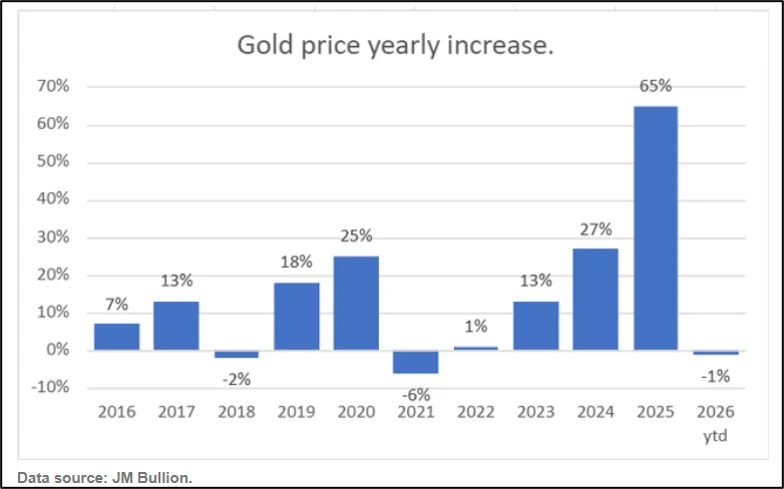
Fig 2: The gold price chart [seekingalpha.com]
Potential Risks and Support Levels
Every financial market carries inherent downside risks. Investors might suddenly prefer alternative assets like cryptocurrencies over traditional safe havens.
If that unlikely shift occurs, prices could drop toward exact production costs. Mining companies need roughly $1,500 per ounce to extract the metal profitably.
This physical extraction cost forms the absolute bottom support level. Such a severe drop remains technically possible but highly improbable today.
Traditional consumer demand for jewellery and cultural purposes also supports the market. This steady physical demand provides a reliable safety net against extreme drops.
The Final Market Outlook
Historical data shows bullion vastly outperforming stock markets this century. The asset grew nearly 15 times its value since the year 2000.
Geopolitical tensions and severe fiscal challenges ensure this upward trend continues. Market participants view any short-term weakness as a prime buying opportunity.
The inverse correlation between yields and bullion no longer dictates market behaviour. Central bank activity provides a much stronger and more reliable market force today.
Economic realities point toward sustained long-term growth. The underlying fundamentals remain remarkably strong for the remainder of the current decade.
FAQ
- Why is bullion holding firm despite rising bond yields?
- Heavy central bank accumulation led by China absorbs a third of yearly mine output, creating an unbreakable price floor around $4,000.
- How does sovereign debt affect the long-term valuation of precious metals?
- Escalating debt-servicing costs force major governments into structural deficits, weakening fiat confidence and driving capital directly into tangible reserves.
- Does an ETF like GLD carry true downside protection?
- GLD tracks physical gold holdings closely with a tiny 0.4% expense ratio, offering deep liquidity without physical handling hassles.
- What marks the absolute bottom price floor if investor sentiment suddenly reverses?
- Marginal production costs around $1,500 per ounce establish the hard baseline where consumer demand and mining realities prevent further drops.
Disclaimer
This article is meant only for informational purposes. If you are an investor who is watching Mineral Resources Limited closely, all the data published in the content is sourced from SEEKING ALPHA and other external sources. Kindly verify all information related to the share price and market data. Any investment should be made at the investor’s own risk.
Filed under
About the author
Hasan MH
Senior markets editor at Mining Herald. Covers resources, macro and corporate strategy across Australia and North America with two decades of capital markets experience.