

Key Takeaways
- 01 Capital discipline is reshaping commodity supply curves into 2026.
- 02 AI infrastructure capex is becoming a primary macro variable.
- 03 Central bank policy across AU, CA and US is converging on neutral.
Commodity markets are pulling in different directions right now. Oil benchmarks are climbing, but a number of grain contracts have dropped hard. Energy, metals and farm goods aren’t moving together at all. Raw material exchanges worldwide are swinging more than usual.
Watching global metal commodities trends is one of the quickest ways for traders to read the broader economy. Energy leads the way up. WTI crude finished the recent session up 1.66%, reaching 90.86 USD/bbl. Over the same period, Brent crude climbed 1.03% to 103.65 USD/bbl, while natural gas trades at 3.01 USD/MMBtu after a slight 0.17% drop. That upward momentum in energy sits in stark contrast to falling values across international food markets.
Farm-based raw materials are under sharp, ongoing pressure. Wheat prices dropped 2.06% to 678.50 USD/bu, and corn contracts fell 3.45% to 504.00 USD/bu at the same time. Cocoa now trades at 5,340.00 USD/MT after dipping 1.26%. Live cattle offers a rare bright spot, rising 1.21% to 223.48 USD/lb. Numbers like these confuse many traditional commodity investors.
Decoding Mixed Signals in Metal Markets
Metals show the same split. Gold edges up just 0.07% to 4,182.80 USD/t oz, a small gain that suggests hesitation among major institutional buyers. Silver moves the opposite way, dropping 1.17% to 60.44 USD/t oz. Base metals also display uneven price action, with copper sitting at 662.10 USD/lb after a modest 0.27% gain.
Erratic price action reflects fractured confidence among international traders. Energy prices strengthen, yet parts of the farm complex remain weak, and precious metals have barely moved this week.
Investors aren’t following one playbook anymore. Many have moved away from the usual inflation and risk hedges, and trading from one day to the next is tough to call. Benchmark contracts spread their gains and losses across multiple segments. Most portfolio managers won’t put everything into one segment. They’d rather hold assets that don’t move together, which leaves the landscape for resource producers fragmented.
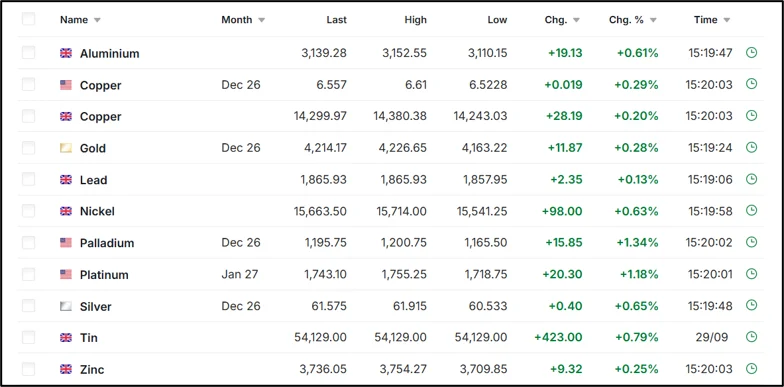
Fig 1: Metal price commodity chart [investing.com]
Understanding Economic Pressure on Metals
To forecast where prices go next, you have to see how economic pressure on metals is hitting the resources sector. Rising bond yields tend to drag gold lower in the short run. A firmer US dollar does the same to precious metals everywhere, since it makes them costlier for buyers abroad.
Anticipated interest rate increases by the US central bank add another layer of complexity. Rate decisions push investors away from non-yielding assets, and traders reallocate their portfolios the moment borrowing costs rise.
High borrowing costs often diminish gold’s appeal, since the precious metal does not generate a standard dividend. Silver has the same problem, but with a twist: it’s part industrial input, part safe haven, so it gets pulled both ways. Copper is simpler. It mostly follows factory activity.
Central Banks Drive Long-Term Demand
Despite these short-term hurdles, official-sector demand stays remarkably firm. Sovereign institutions are maintaining an active and consistent pace in their bullion acquisition strategies. Official purchases, both reported and unreported, are running well above what we saw before 2022.
These institutions are executing a longer-term reserve-allocation shift to diversify their assets. They want to reduce their dependence on the US dollar over the next decade, and this structural change provides a solid floor for global gold prices.
Heavy buying from major national banks also provides a reliable buffer against short-term price swings driven by retail traders. Retail investors might panic and sell, but national banks simply keep buying. The result is a real push and pull in physical bullion, with retail sellers on one side and central banks on the other.
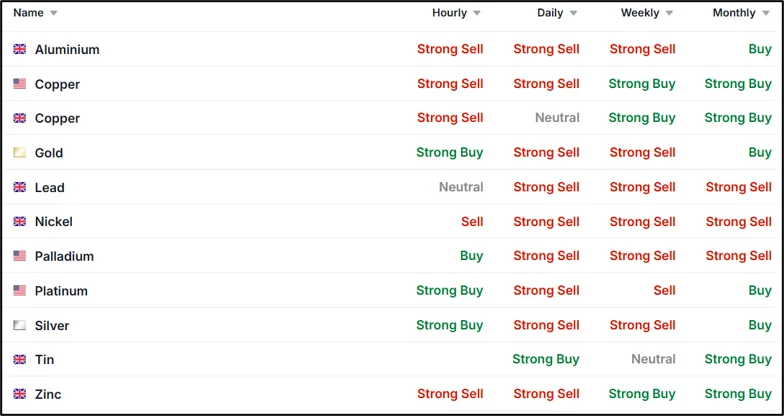
Fig 2: Metal price commodity technical chart [investing.com]
How Supply Chains Are Taking the Hit
When raw material prices jump around, global logistics suffers. Firms that rely on fuel, factory parts or bulk food inputs run into problems almost daily, and working out next quarter’s production costs gets very hard. Finance teams need steady material and power prices to build a workable budget. Sharp moves in copper and silver leave tech manufacturers revising their forecasts again and again. Firms stuck with rigid pricing structures suffer greatly in this chaotic environment.
Purchasing teams are putting significant effort into protecting their margins from unexpected cost spikes. They use complex derivatives contracts to lock in raw material costs, because a sudden spike in energy costs can ruin profit margins for metal refiners.
Future Outlook for Resources
Costs at extraction sites change daily, and that puts miners under heavy pressure. Their big machines burn through a lot of diesel just to bring ore out of the ground. When crude surges, every ounce of gold or silver they produce costs noticeably more.
Miners end up caught in a bad cycle. Power bills rise, but the metals they sell don’t command higher prices. As profits shrink, executives put new exploration on hold.
Financial experts expect this broken market sentiment to continue for the rest of the quarter. Traders are watching inflation numbers and reserve bank announcements closely, since new financial figures can quickly push investment dollars between the energy, metals and farm sectors. Smart fund managers shift their holdings quickly when conditions change. They also know a broad commodity rally rarely lifts everything at once. That’s why resource markets call for sector-by-sector analysis, not one blanket strategy.
FAQ
- What causes the current price split between gold and silver?
A. Central bank buying supports gold prices. At the same time, weak factory demand is holding silver back. - How do conflicting metal trends impact resource mining equities?
A. Expensive diesel and power squeeze company profit margins. This squeeze happens even if underlying metal prices show slight improvements. - Do national bank purchases protect against major market downturns?
A. Consistent institutional buying prevents massive price crashes. This steady demand provides solid long-term backing regardless of daily market chop.
Disclaimer
This article is meant only for informational purposes. If you are an investor who is watching Mineral Resources Limited closely, all the data published in the content is sourced from ASX announcements and external sources. Kindly verify all information related to the share price and market data. Any investment should be made at the investor’s own risk.
Filed under

About the author
Jonathon Brown
Jonathon Brown began his career as a broadcaster, working across markets in British Columbia before moving into financial journalism. Since 2017, he has specialised in stock market reporting, covering emerging companies across the healthcare, technology, mining and consumer sectors. He brings more than 15 years' experience to his reporting. A graduate of Vancouver Island University and the British Columbia Institute of Technology, Jonathon is focused on delivering clear, balanced reporting for investors.